
Turn raw sensor packets from any station, any vendor, into a single normalized real-time view — from live fleet maps to scheduled PDF reports, from a 26-equation calc engine to time-boxed remote access.

One source of truth for every sensor
Most monitoring deployments are a patchwork: one vendor's logger here, a different model there, CSV uploads from a third site — each with its own captions, units, and quirks. Live3 solves the integration problem at the data layer. Sensors are normalized into a canonical type system once, calculations run automatically on every reading, and everything downstream speaks the same clean vocabulary.
Vendor-Agnostic
Aeron loggers, third-party hardware, and CSV uploads all land in the same normalized pipeline.
Real-Time First
Live readings, live map, live alerts — with intraday min/max as data arrives.
Built for the Field
Remote SSH, device-local timezones, and offline detection mean fewer truck rolls and faster fixes.
Trustworthy by Design
Audit logs, RBAC, and a calculation engine that shows its work.
The platform, up close
From fleet-wide visibility to deep-dive analytics — every view built for operators.
Everything your operations need
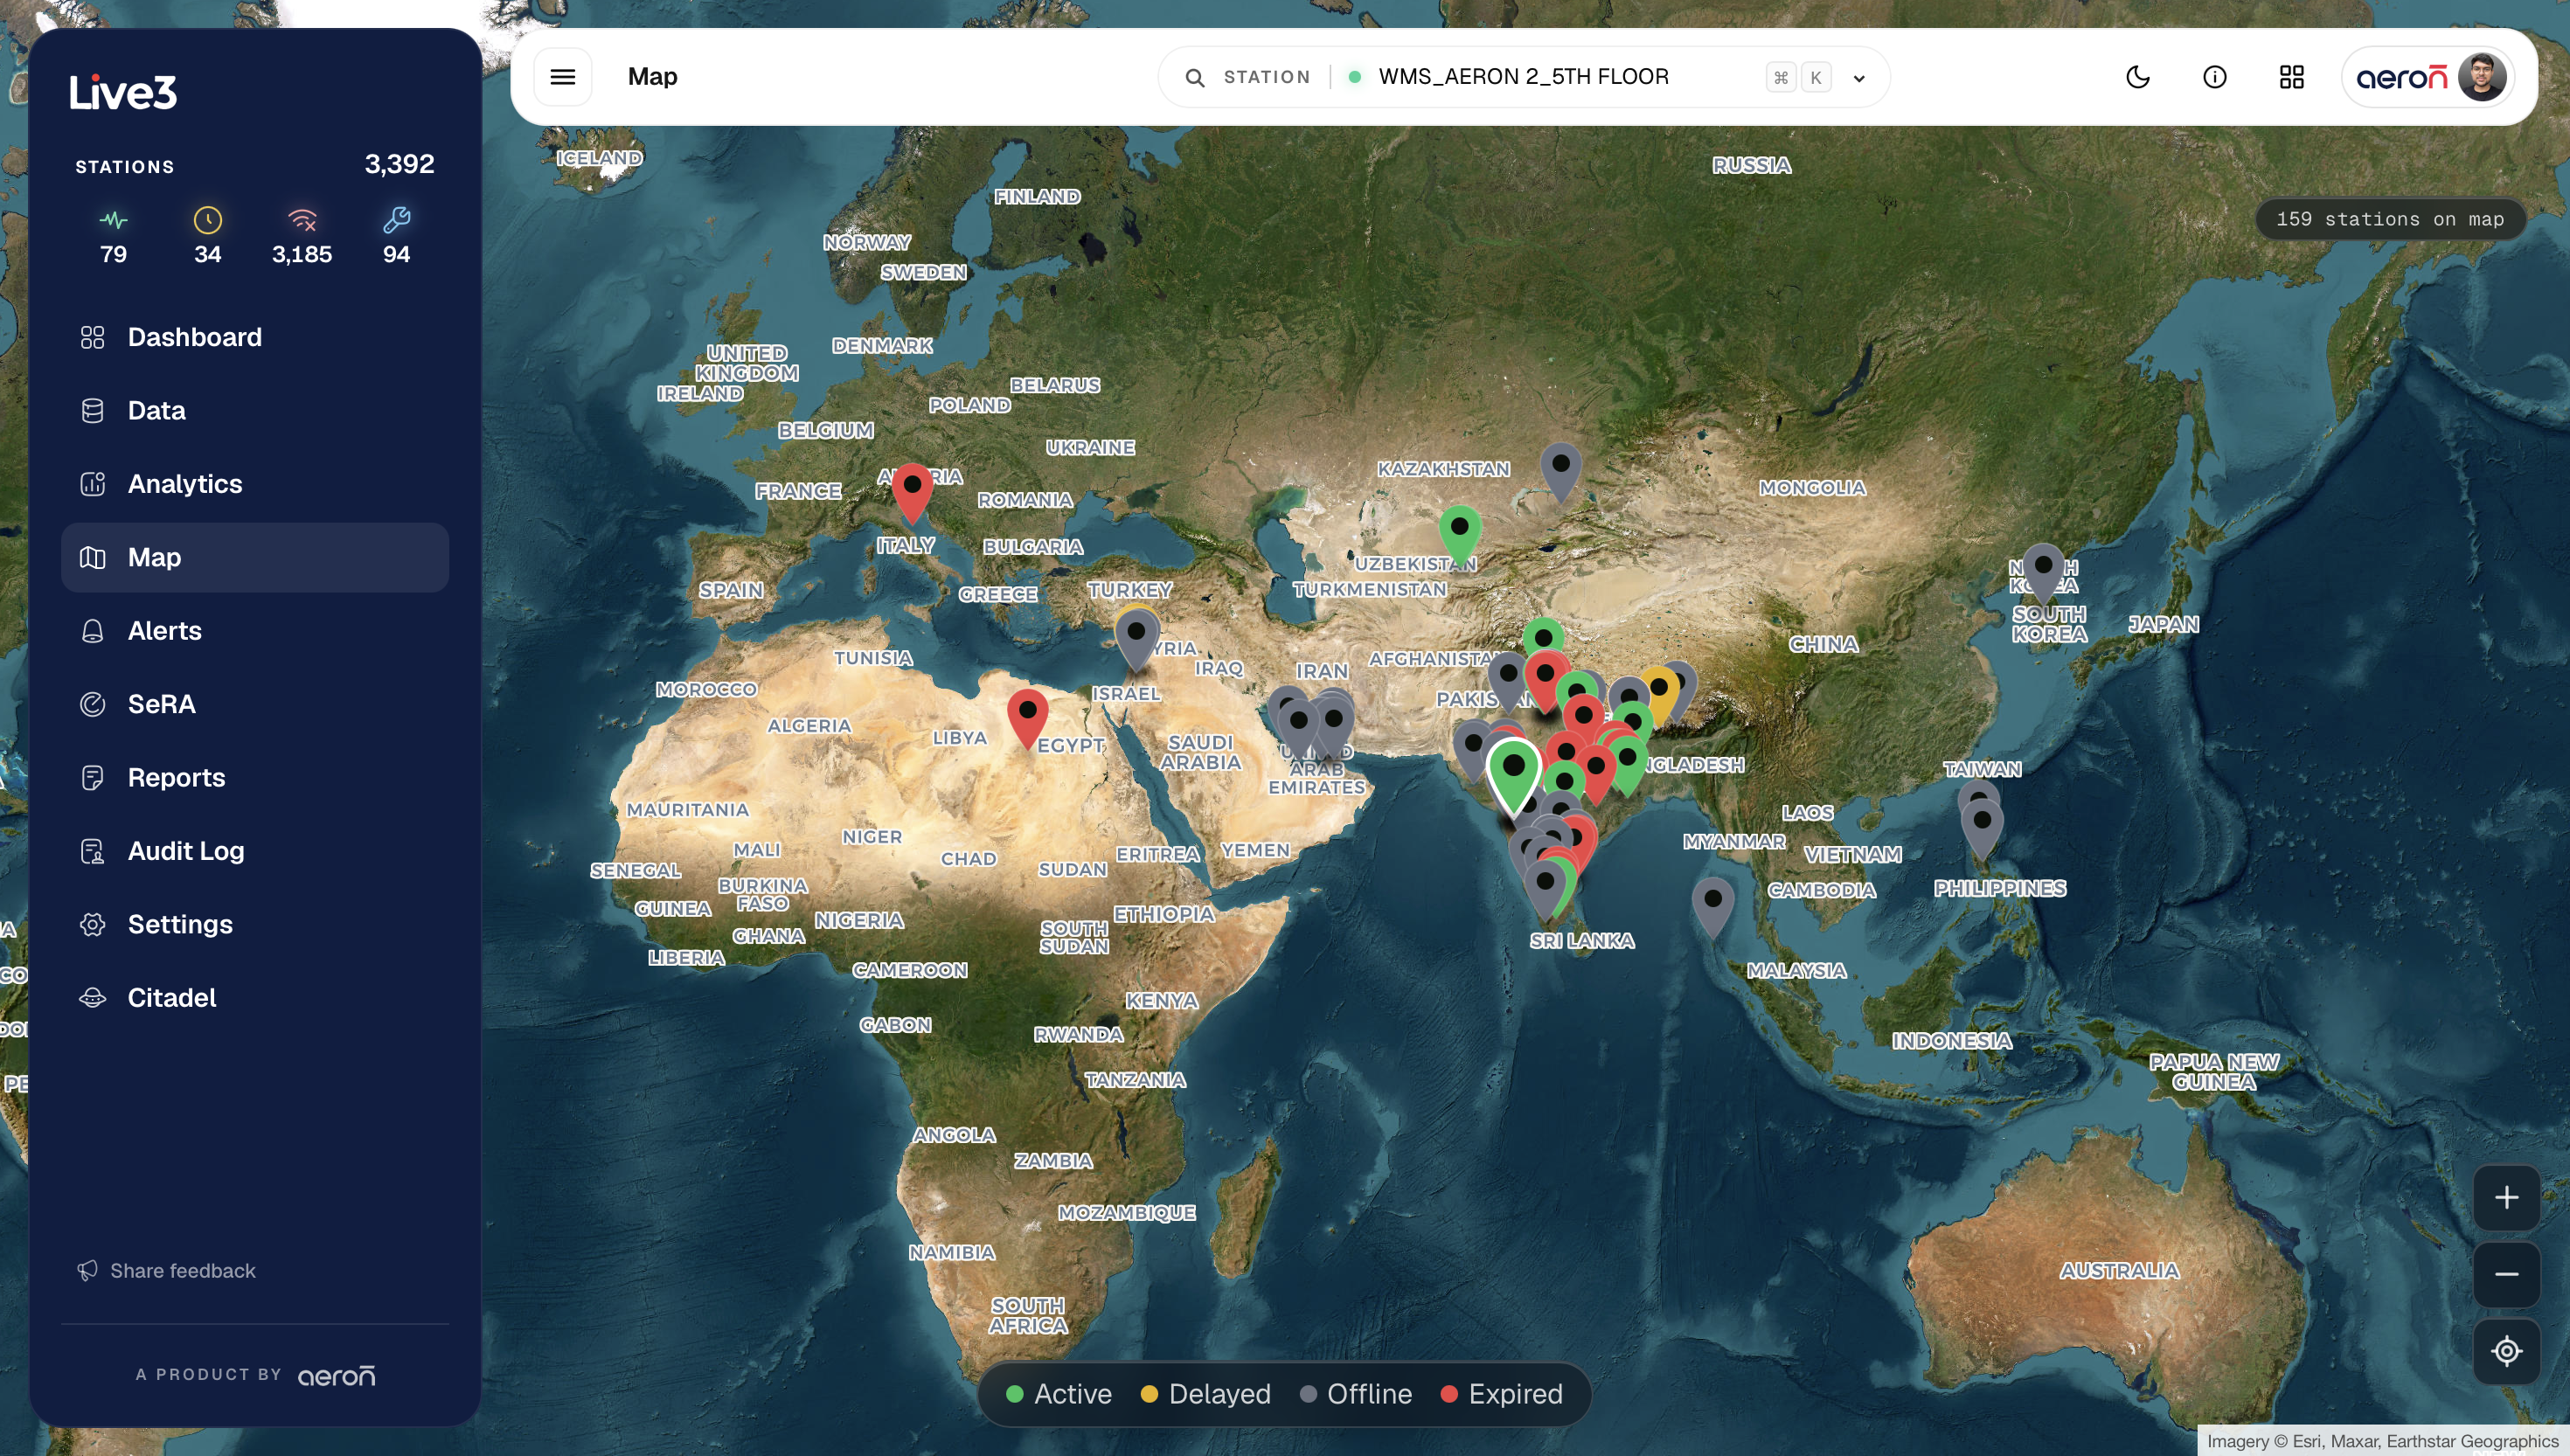
Live Fleet Map
Status-coloured pins for every station on a satellite basemap, each showing last-seen timestamp. Spot offline or unhealthy stations instantly.
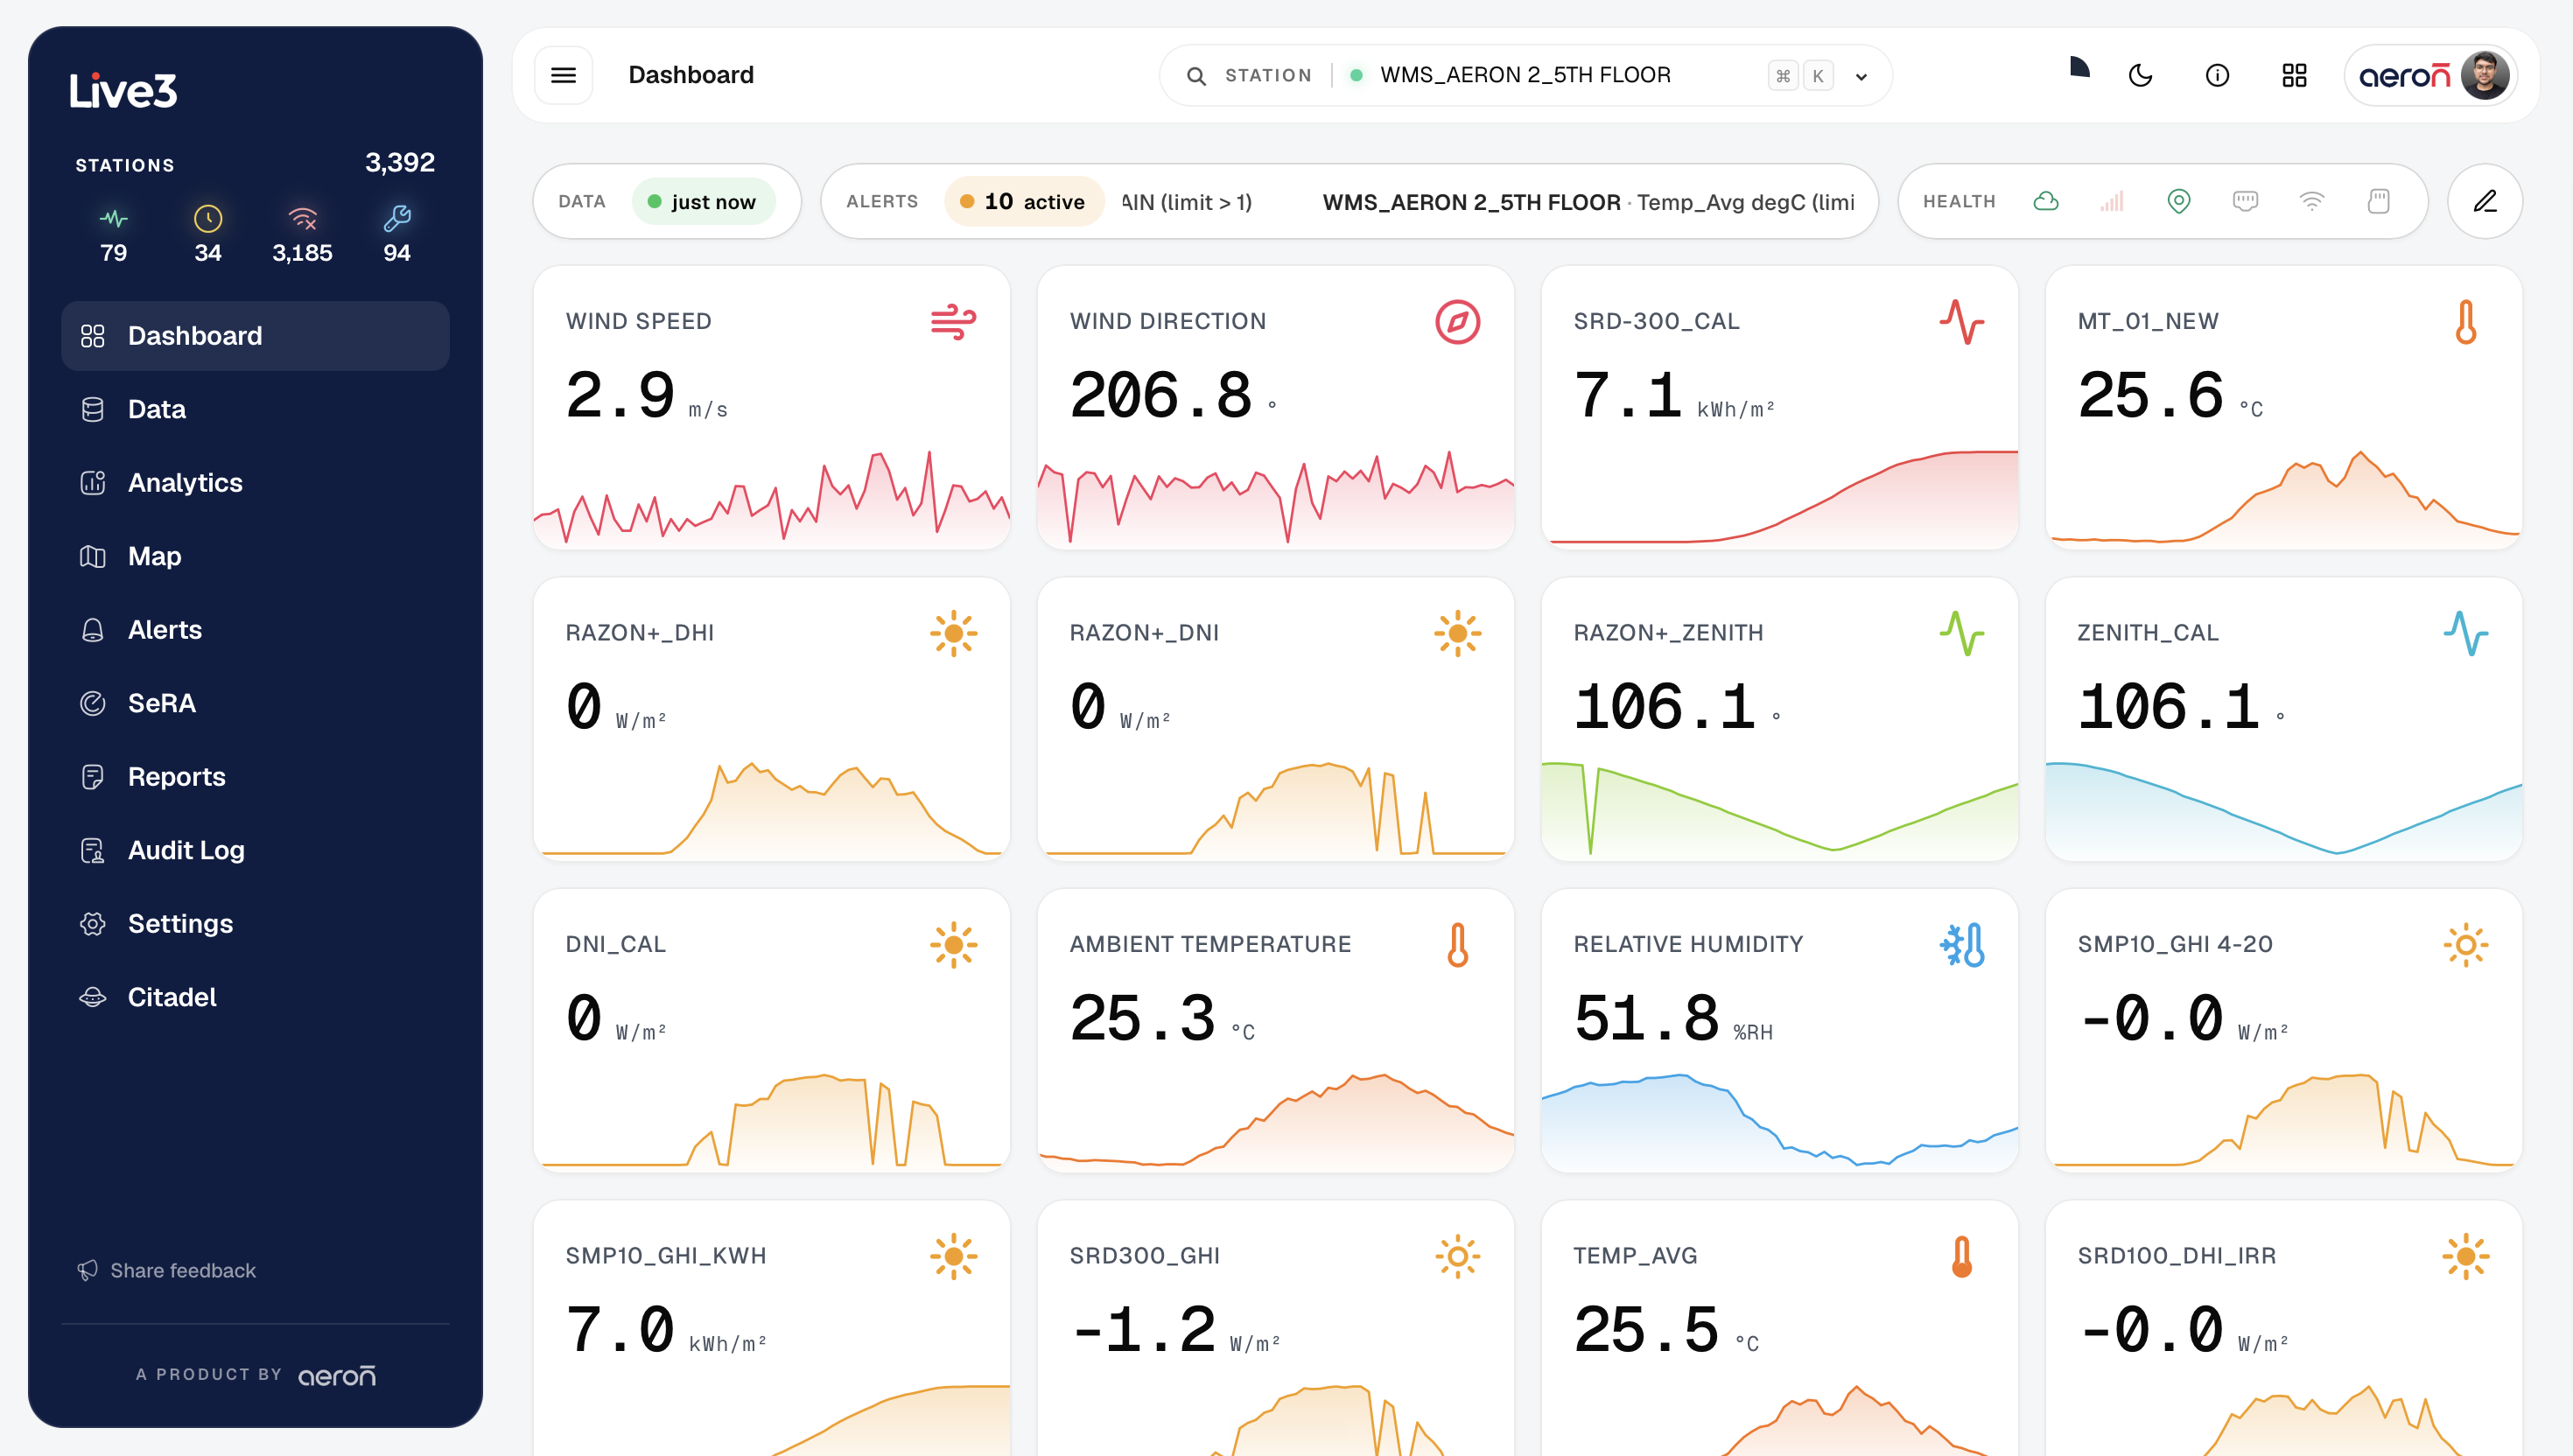
Real-Time Dashboard
Per-station live readings with intraday min/max and custom chart presets. Build the views your operators actually use.
Canonical Type System
Normalize multi-vendor sensors so captions, units, and thresholds are set once — applied everywhere. No more reconciling "Temp" vs "AirTemp".
26-Equation Engine
PR, CUF, energy integration, rainfall accumulation, CPCB AQI, and NSF WQI auto-computed on every reading. Derived metrics alongside raw data.
Sustain-Logic Alerts
2-reading sustain to suppress false alarms. 24-hour re-fire window so you are reminded without being spammed. Up to 10 recipients per alert.
SeRA Remote Access
Time-boxed, browser-based SSH tunnels into any capable field device. Diagnose and fix hardware remotely — no truck roll, no permanent open port.
Scheduled PDF Reports
Daily, weekly, and monthly reports auto-emailed with your branding and chosen parameters. Numbers land in stakeholders' inboxes without any manual export.
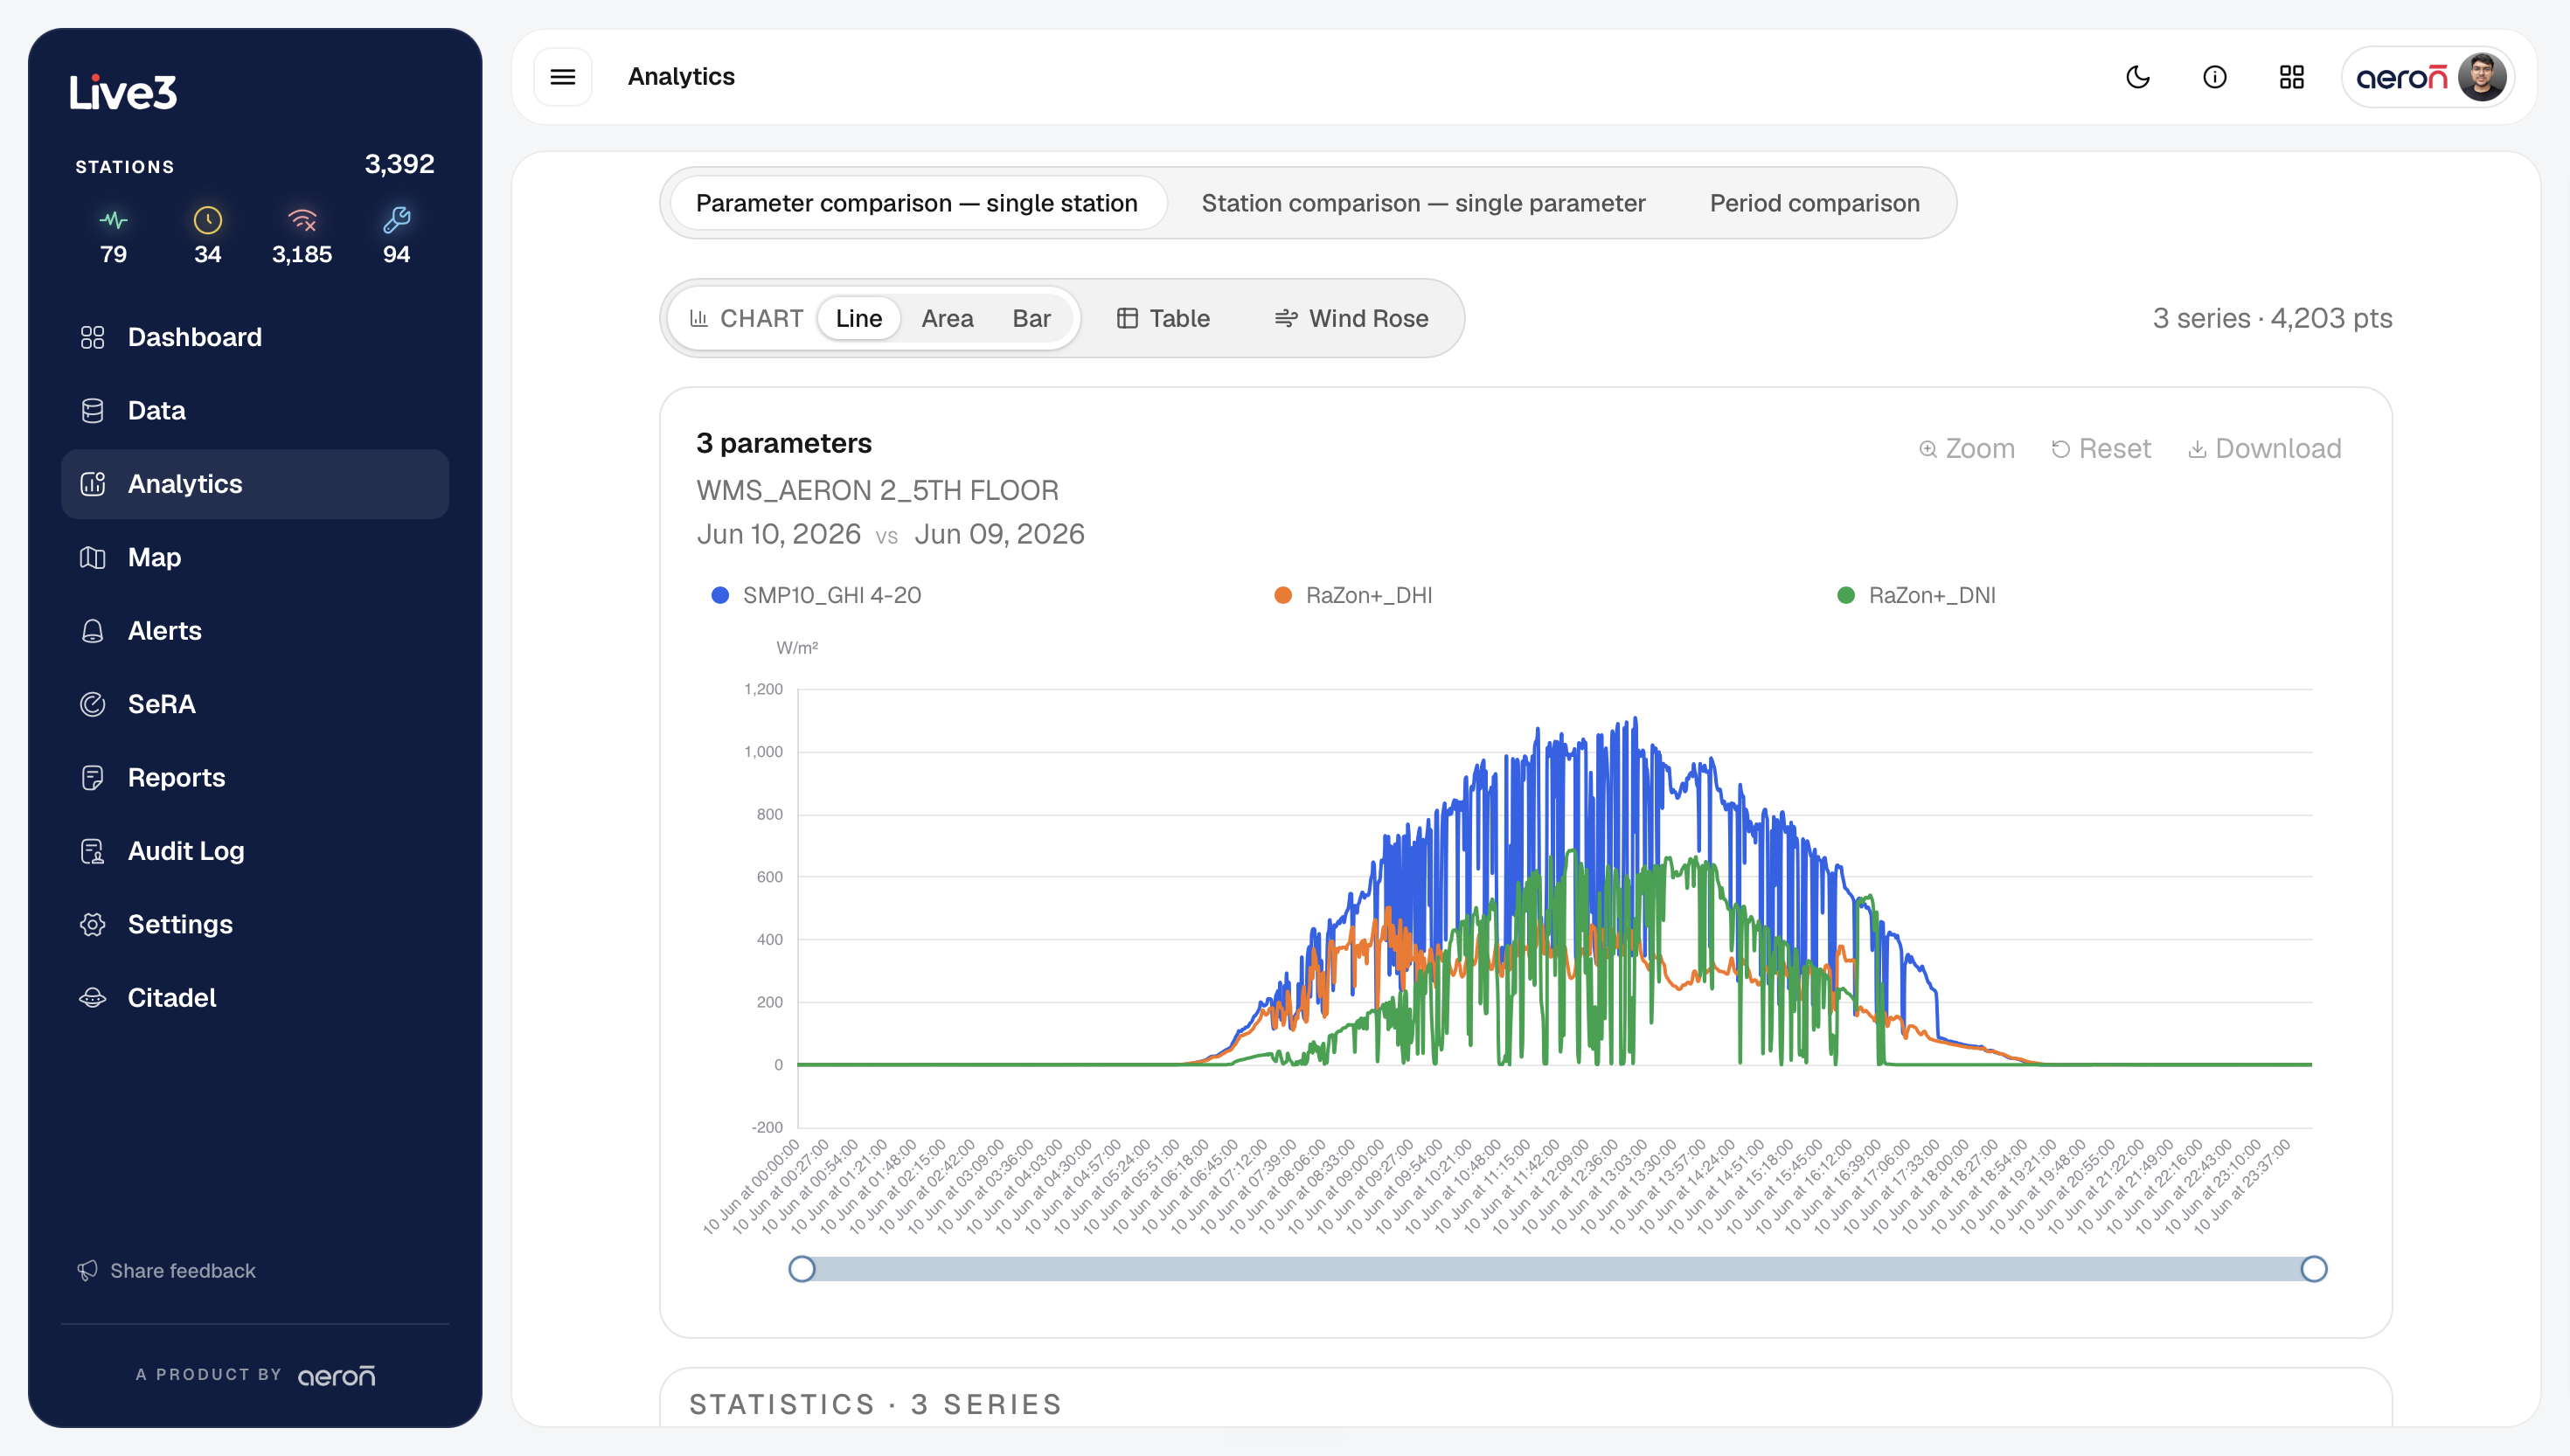
Three-Mode Analytics
Compare parameters, stations, or time ranges with configurable aggregation. Includes a wind rose for directional analysis.
Regional Residency
Per-region RDS clusters with a federated superadmin view and device-local timezone rendering. Keep data in-region for compliance.
Audit + Event Logs
Full who-did-what trail with device-timezone timestamps, CSV-exportable. Every config change and operator action is accountable.
Public REST API
/api/v1 with organization-owned keys and org-wide scoping. Pull normalized, calculated data straight into your own systems and BI tools.
RBAC + Auth0 SSO
Four roles plus per-page visibility from the admin UI — no deployment needed. Single sign-on across every Aeron product with one identity.
How It Works
Five stages from raw packet to trusted insight. Every surface reads from the same normalized store — dashboards, alerts, API, exports all agree.
Live packets from Aeron loggers or CSV uploads — both idempotent
Canonical type mapping: captions, units, and thresholds set once
26 equations: PR, CUF, AQI, WQI, rainfall, energy — on every reading
Regional Postgres, monthly partitions — single source of truth
Dashboards, alerts, analytics, reports, API — all surfaces agree
Both ingest paths write idempotently — duplicate or replayed packets never corrupt the record. Raw readings and 1-minute rollups are stored in monthly-partitioned tables for fast queries and clean retention.
Built for every environment
One platform. Air, water, weather, energy, and mixed-vendor deployments — all normalized into the same operational view.
Solar & Renewable Energy
PR, CUF, and energy integration across plant fleets, with performance alerting.
Air Quality Networks
CPCB AQI per station, threshold alerts, scheduled public-facing reports.
Water Quality Monitoring
NSF WQI auto-computed, multi-parameter dashboards, compliance exports.
Weather & Meteorology
Wind rose analytics, rainfall accumulation, multi-station comparison.
Mixed-Vendor Deployments
One normalized view over Aeron loggers, third-party hardware, and manual CSV sites.
At a Glance
The complete capability summary — every feature, every surface, one place.
Security + Governance
Enterprise-grade security baked into every layer — not bolted on after.
Auth0 Single Sign-On
SSO across the entire Aeron product suite — one identity everywhere.
Role-Based Access Control
Four roles with per-page visibility from the admin UI — no deployment required.
Centralized Secrets Vault
Never plaintext, never on disk. Automated sync to the deployment platform.
Read-Only Consumer Roles
SELECT-only DB roles for analytics consumers — production data can never be mutated.
Per-Person Credentials
IAM-backed auth for humans; service credentials isolated from human access.
Regional Data Residency
In-region storage for compliance, with a global federated superadmin view.
Built for production scale
Real product numbers — not marketing estimates.
PR, CUF, AQI, WQI, energy — auto-computed on every raw reading
Per rule, with sustain-logic false-alarm suppression and 24-hr re-fire
Solar, air quality, water quality, weather, and mixed-vendor deployments
Fleet map, dashboards, reports, analytics, SeRA, audit logs, API and more
Any input. Every output.
Bring your existing hardware or historical data — Live3 normalizes everything into one real-time, calculated, alert-ready pipeline.