Browser-based platforms that collect, normalize, and analyze sensor data from any hardware vendor — delivering live dashboards, automated alerts, scheduled reports, and open API access, all from one place.

What cloud software does
Four core capabilities shared across every product in this solution category.
Real-Time Ingestion
Receive live data packets from any Aeron logger or third-party device the moment they arrive, with CSV bulk-upload for legacy or offline sites.
Unified Normalization
Canonical type system maps every vendor's captions, units, and ranges into one clean vocabulary — set once, applied everywhere downstream.
Automatic Computation
Derived metrics — PR, CUF, energy totals, AQI, WQI, rainfall accumulation — calculated on every reading. No manual scripting.
Enterprise Security
Auth0 SSO, 4-role RBAC, per-page visibility, audit logs, read-only DB roles, and regional data residency baked in at every layer.
Three views. One platform.
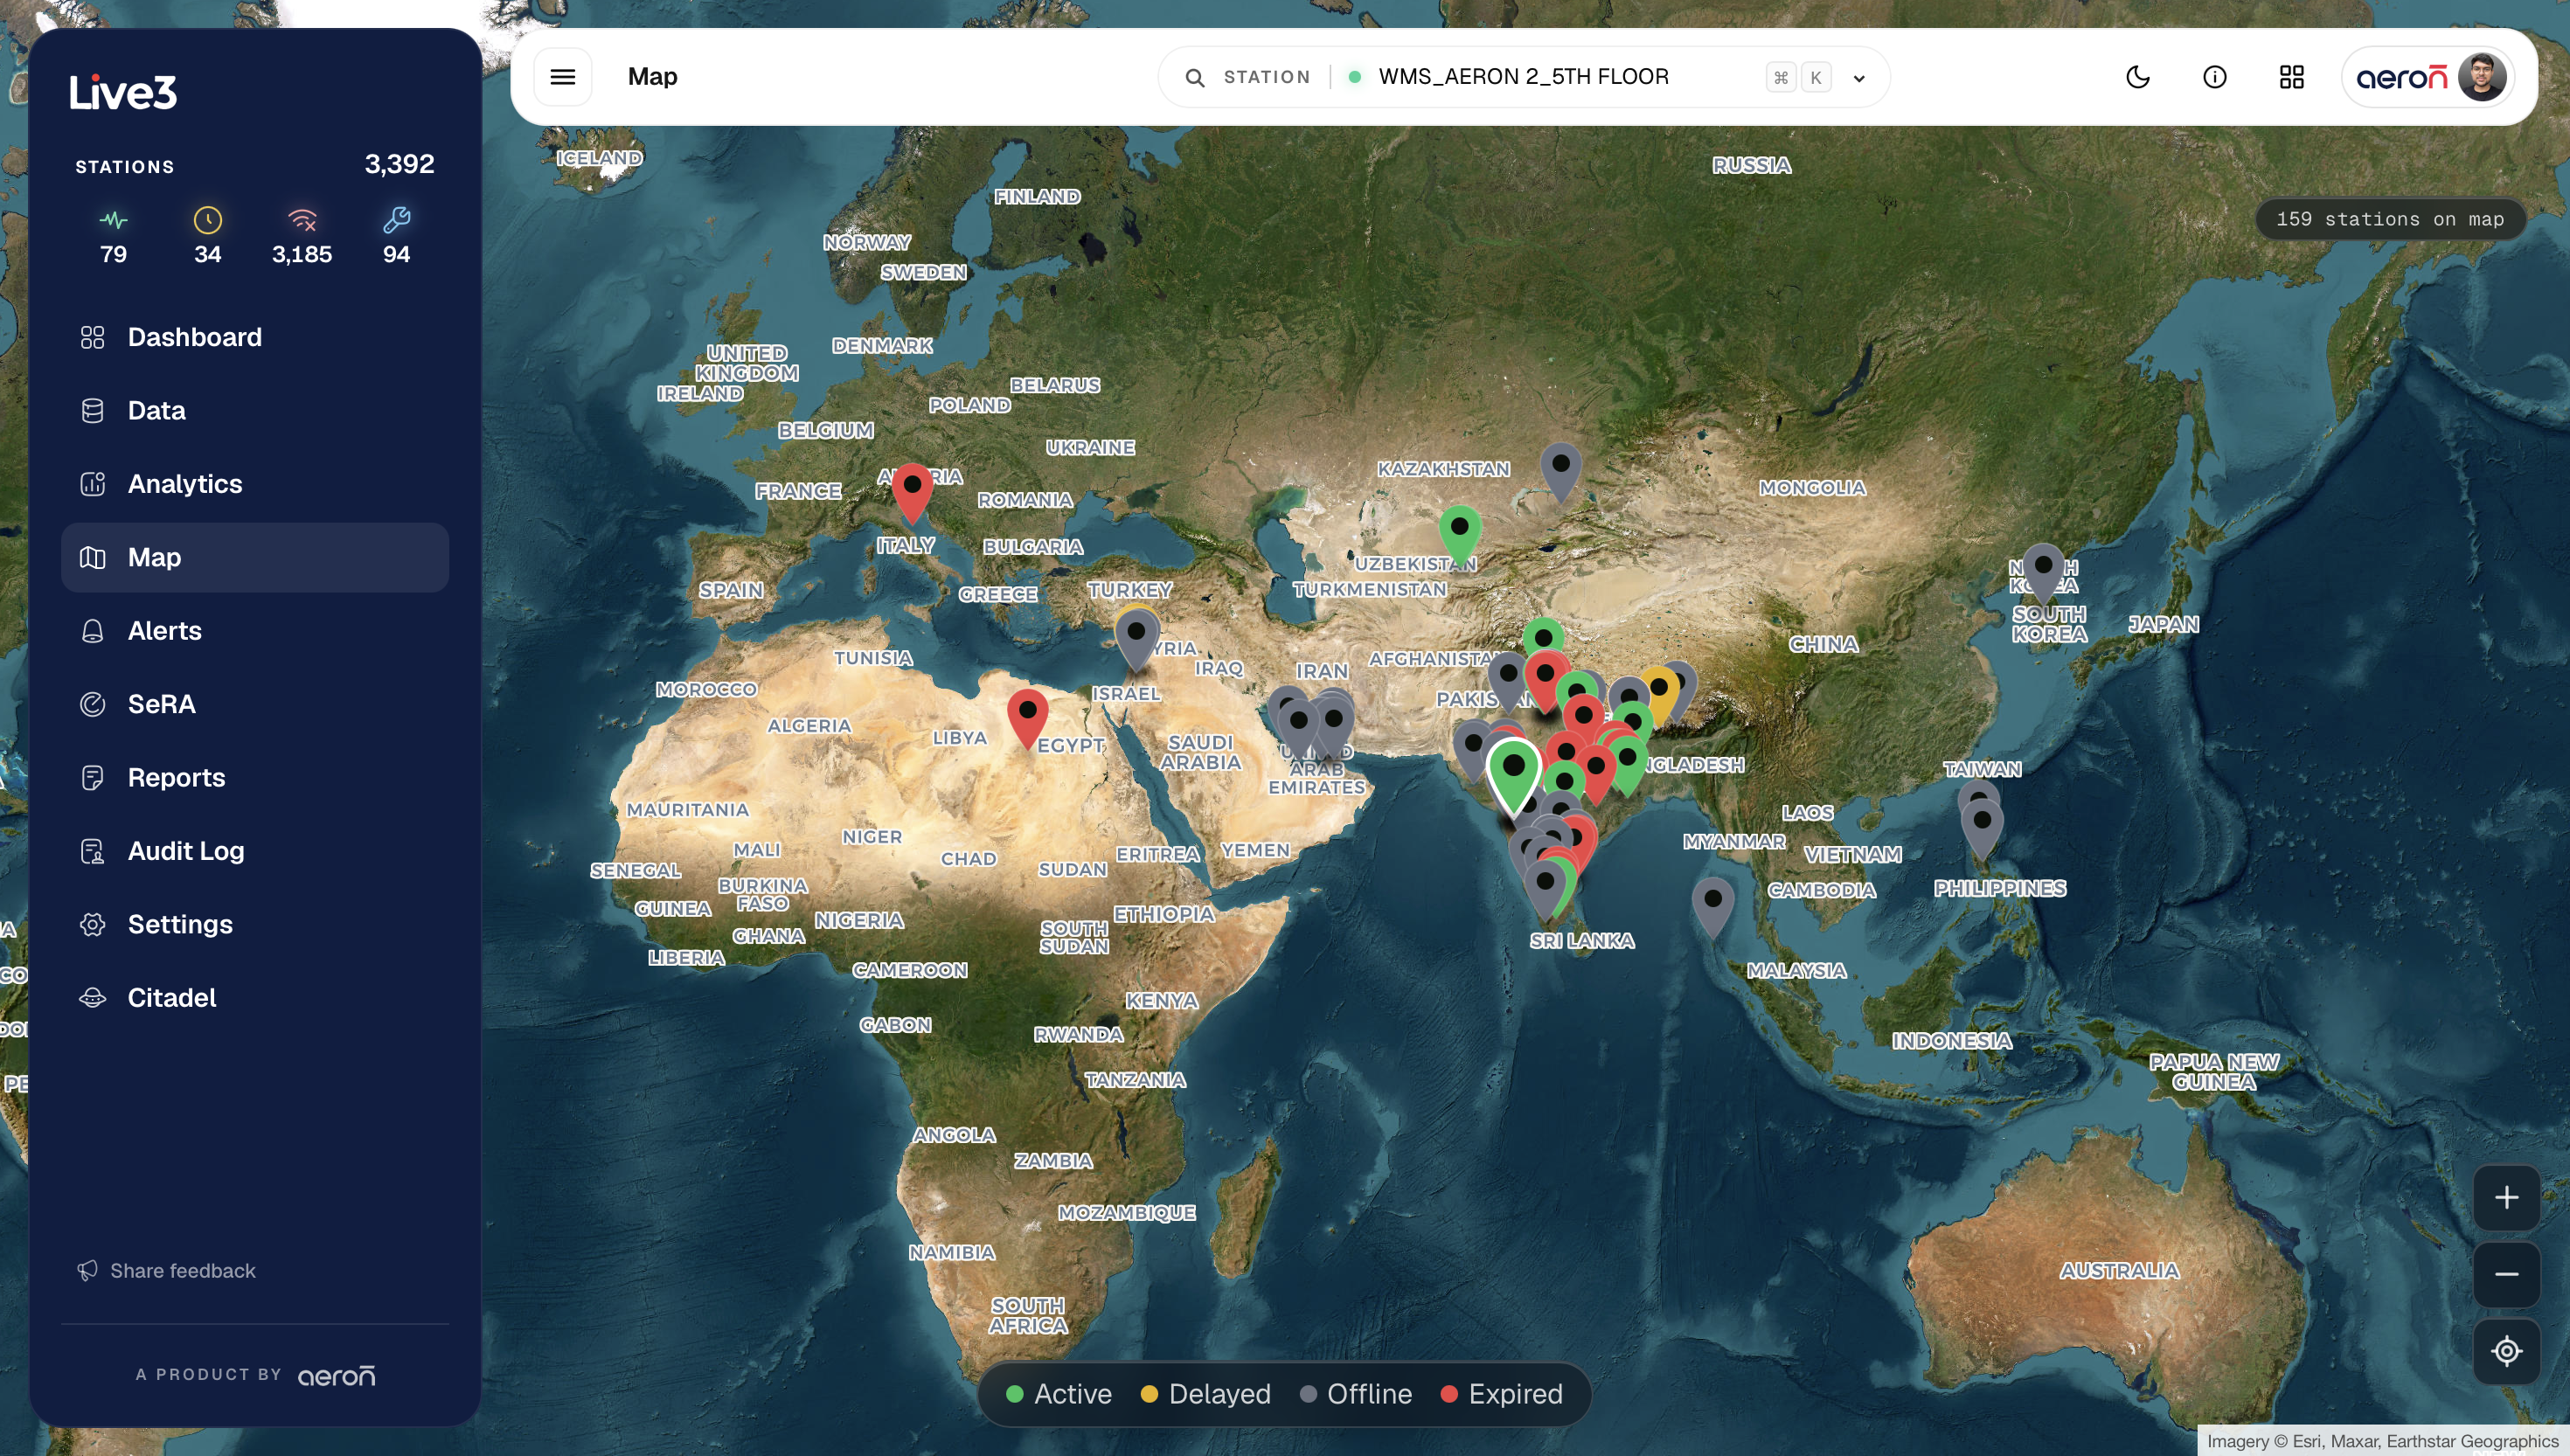
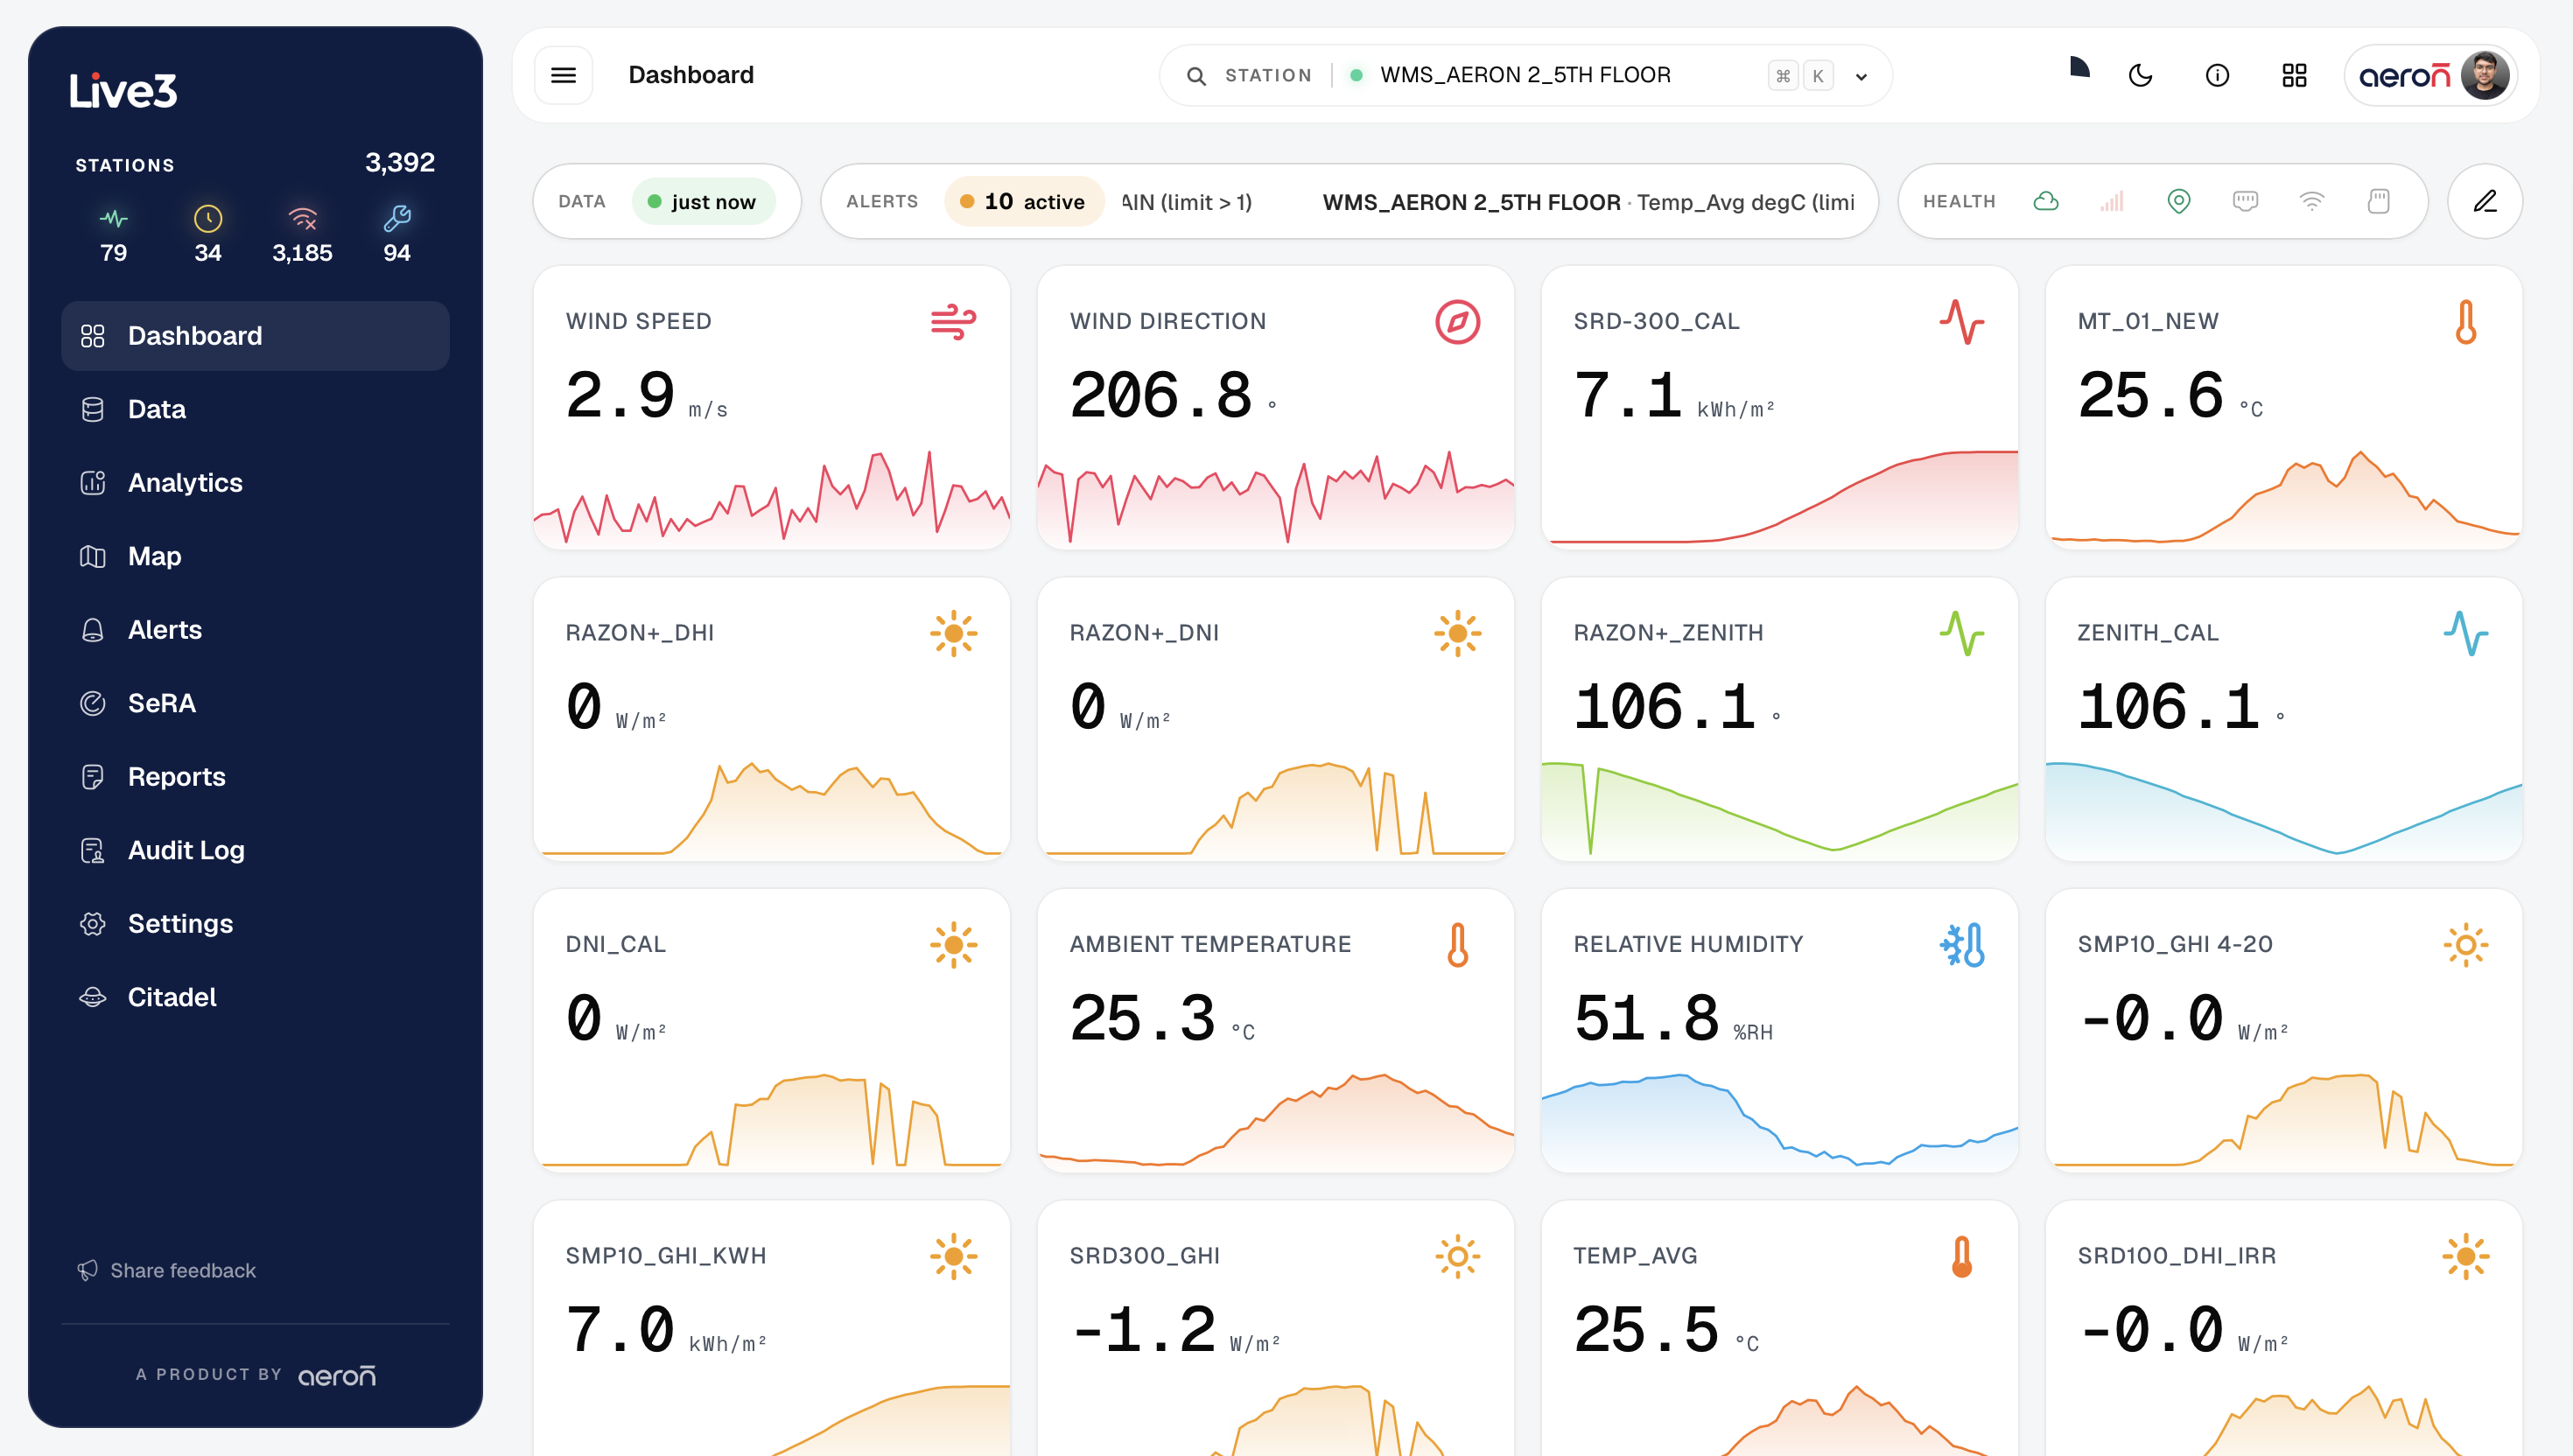
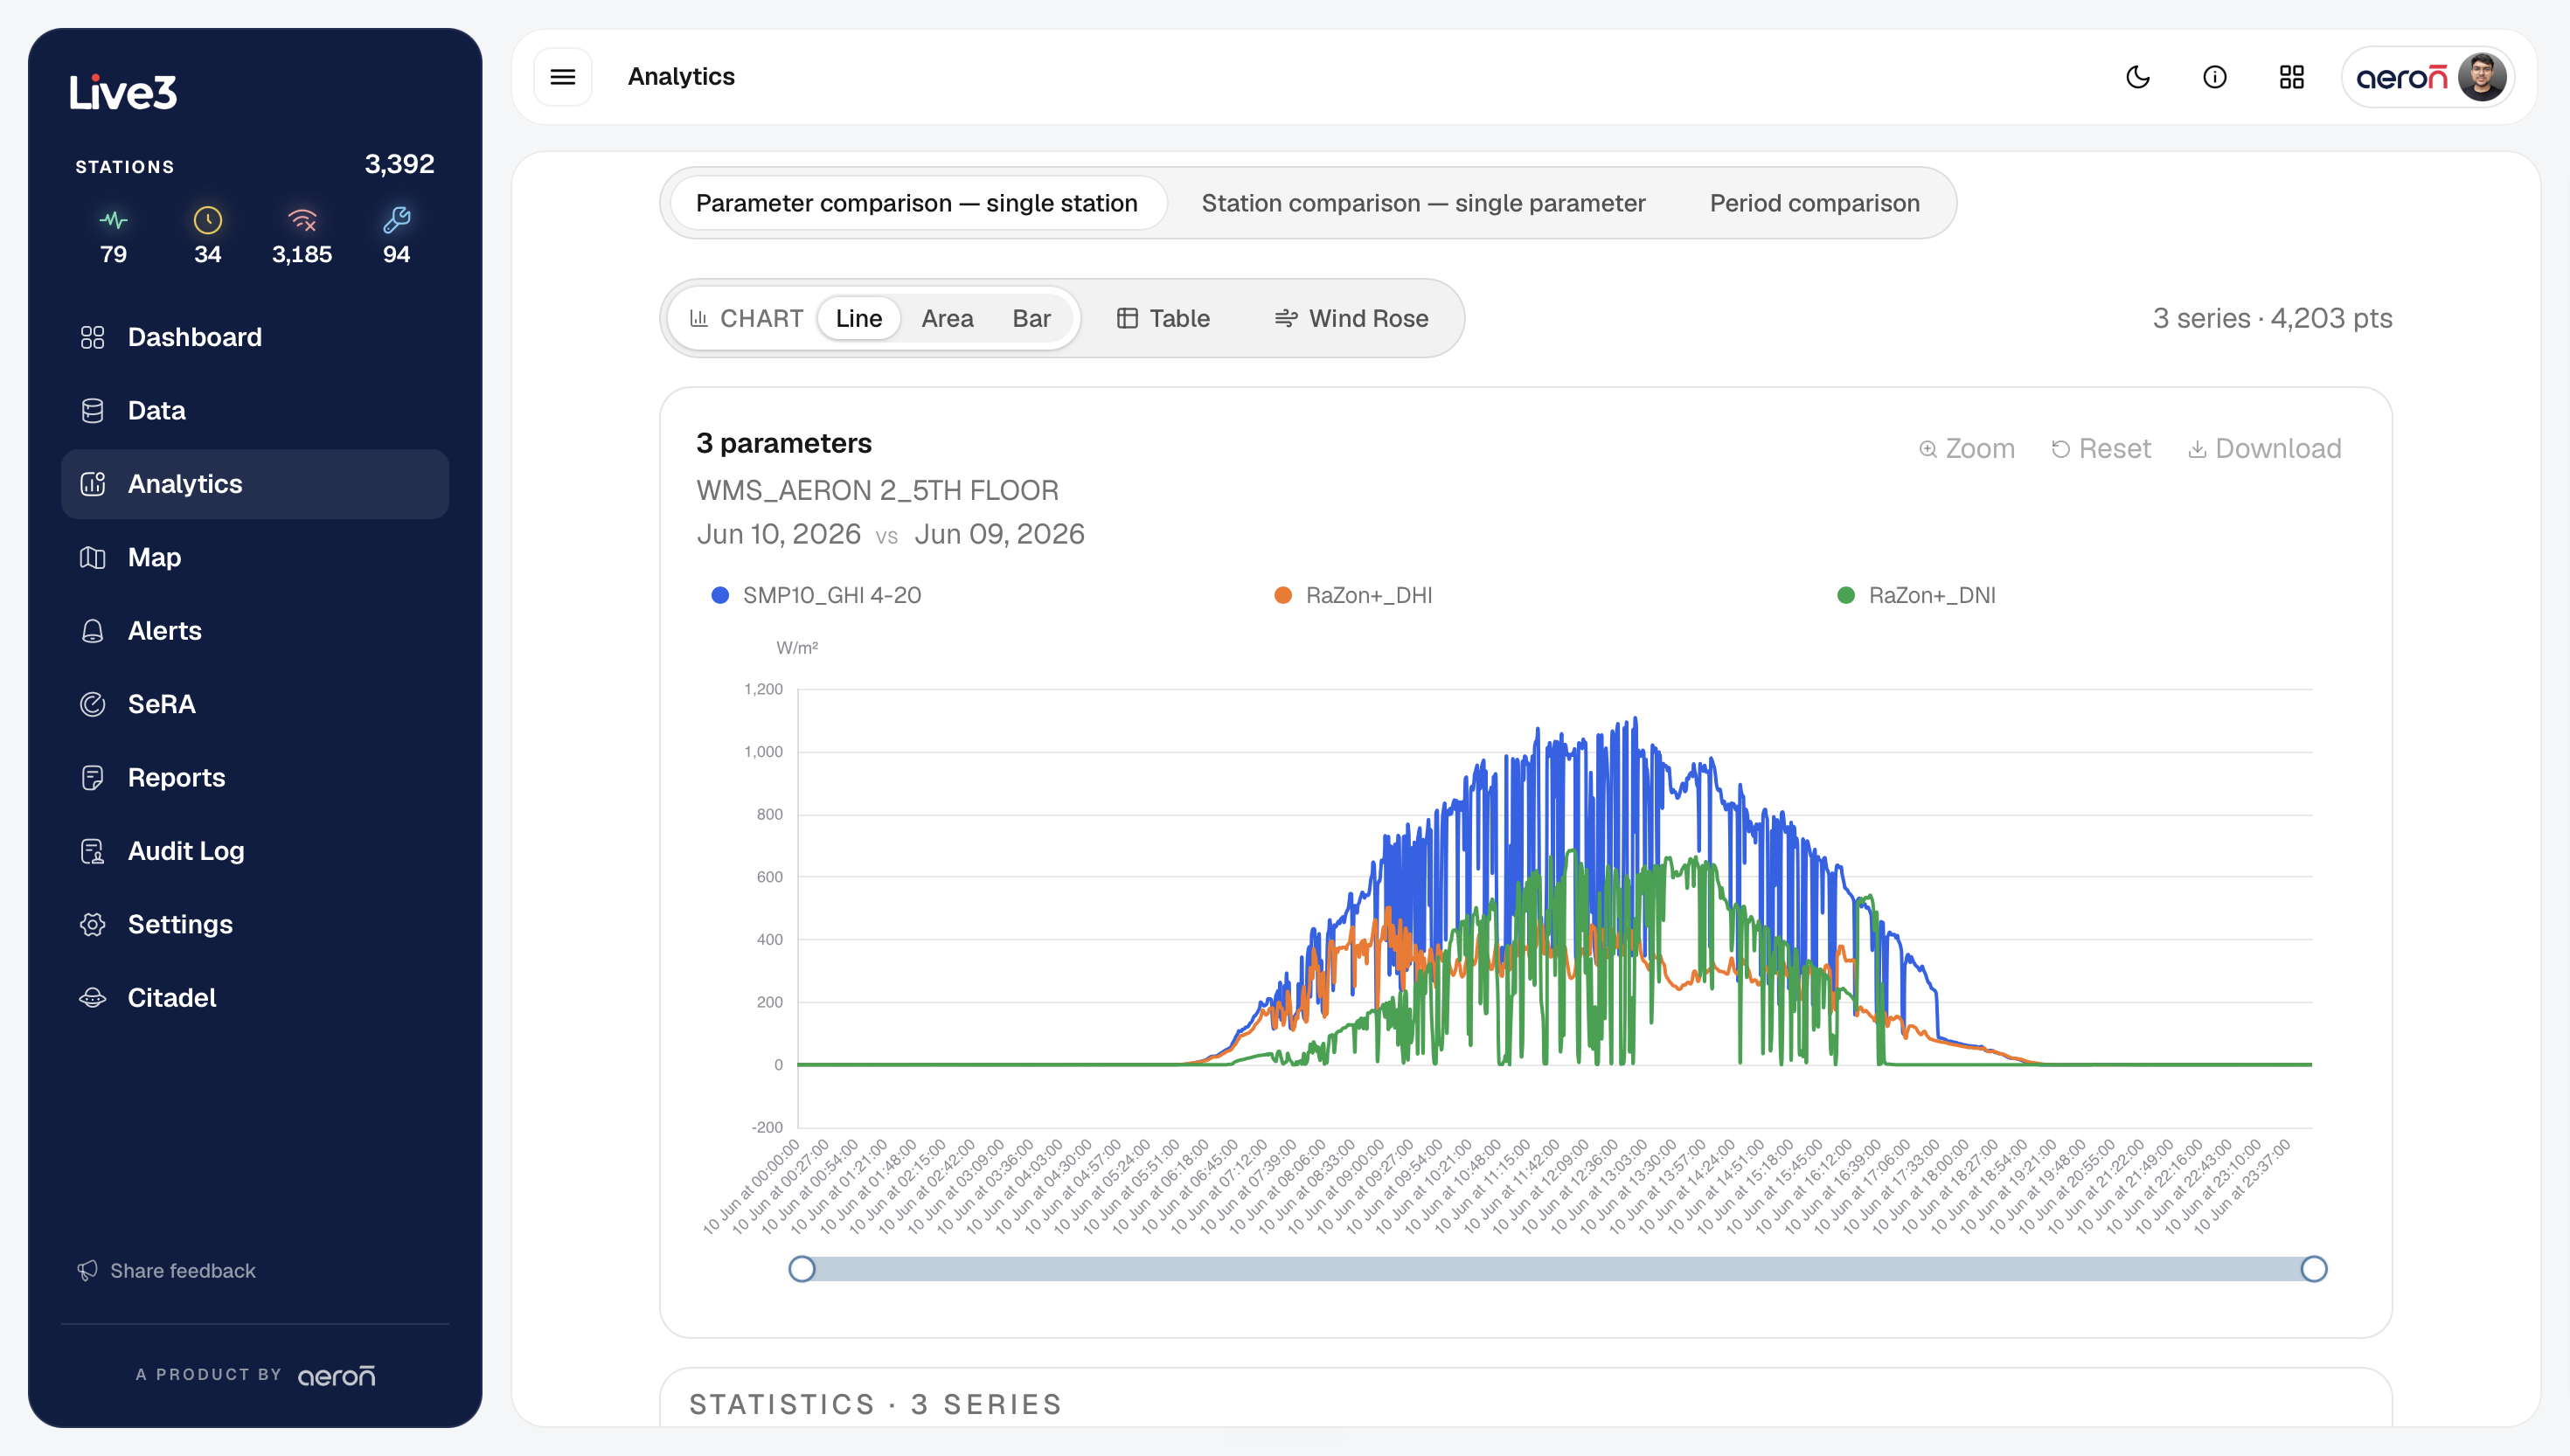
From fleet-wide visibility to deep-dive analytics — every view built for operators who need answers, not exports.
Cloud software platforms
Purpose-built monitoring and analytics platforms for environmental and industrial applications.
Additional cloud software products are under development. Contact us to learn what's on the roadmap.
Built for every environment
Air, water, weather, solar, and industrial — one normalized operational view across all domains.
Solar & Renewable Energy
PR, CUF, and energy integration across utility-scale and C&I fleets, with IEC-compliant performance alerting and operator reporting.
Air Quality Networks
CPCB AQI per station, sustain-logic threshold alerts, and scheduled public-facing reports auto-emailed to regulators and stakeholders.
Water Quality Monitoring
NSF WQI auto-computed on every reading, multi-parameter dashboards, and compliance-ready CSV exports for environmental and utility operators.
Weather & Meteorology
Wind rose analytics, rainfall accumulation, and multi-station comparison for met agencies, research institutions, and agri-tech operators.
Mixed-Vendor Deployments
One normalized operational view over Aeron loggers, third-party devices, and manual CSV uploads — without changing any field hardware.
Industrial & Process IIoT
Modbus RTU/TCP integration with energy meters, inverters, and SCADA — real-time plant performance visibility and fault alerting.